
GrafLens
WhiteMatter Technology, LLC
No ratings yetDeveloper ToolsAges 4+
Screenshots



About this app
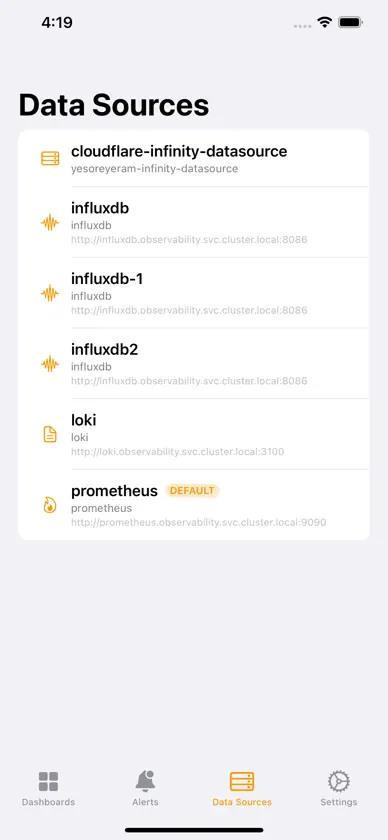
GrafLens is a free, open-source native iOS viewer for Grafana dashboards. Connect to any Grafana instance and monitor your infrastructure on the go — no ads, no tracking, no account required. KEY FEATURES • Connect to any Grafana instance using a service account token • Browse dashboards organized by folder with full-text search • View panels with configurable time ranges from 5 minutes to 30 days • Monitor firing alerts and create silences for maintenance windows • Add annotations to mark deployments, incidents, and events • Generate shareable dashboard snapshots • Manage folders and playlists from your phone • Edit dashboard metadata (title, description, tags) on the go • Multiple server connections — switch between Grafana instances instantly • Star your favorite dashboards for one-tap access • Recently viewed dashboards always at your fingertips • OIDC/OAuth support (Authentik, Okta, Google, etc.) HOME SCREEN WIDGETS Pin any specific Grafana panel from any dashboard directly to your iOS home screen. Configure widget size (small, medium, large) and time range. Updates automatically every 15 minutes. SIRI SHORTCUTS Ask Siri "Check GrafLens alerts" to instantly see how many alerts are firing without opening the app. Perfect for on-call engineers who need at-a-glance status. SPOTLIGHT SEARCH GrafLens indexes your dashboards in iOS Spotlight. Search for any dashboard from your home screen and tap to jump straight in. PRIVACY FIRST GrafLens does not collect, transmit, or store any personal information on remote servers. The app communicates only with the Grafana instance you configure. There is no analytics, no telemetry, no advertising, and no third-party SDKs. Your service account token and connection details are stored locally on your device only. OPEN SOURCE GrafLens is fully open source under the MIT license. Review the complete source code, file issues, or contribute features at github.com/whitematter-tech/graflens PERFECT FOR • DevOps engineers monitoring infrastructure • SRE teams tracking service health • On-call engineers responding to incidents • Developers checking application metrics • Anyone who wants Grafana on their phone GrafLens is developed and maintained by WhiteMatterTech in coordination with the open source community. For support, feature requests, or to report bugs, visit our GitHub repository or contact us at support@whitematter.tech
What's new
Version 2.0 · Nov 4, 2026
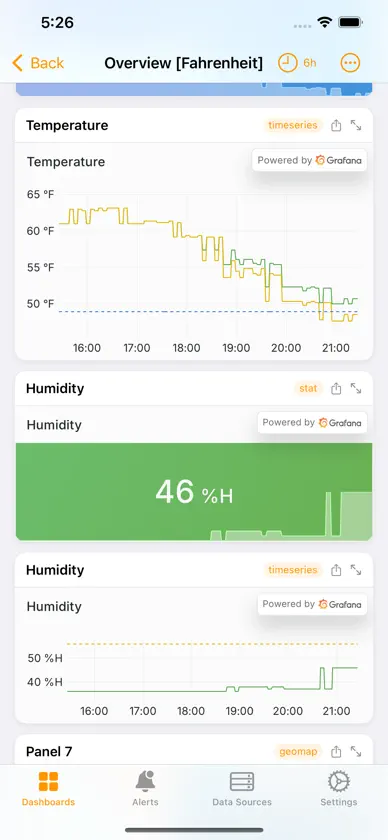
GrafLens 2.0 introduces a redesigned dashboard experience with clearer typography, refined panel layouts, and improved graph rendering. Supported Prometheus panels now use native charts with interactive crosshairs, series controls, annotation markers, stat sparklines, and gauges. Charts preserve gaps in missing data, while complex and unsupported panels continue using Grafana’s original rendering. All dashboard panels begin loading when you open a dashboard, including panels offscreen. Cached results and embedded Grafana pages remain available as you scroll, eliminating repeated loads and preserving interactive page state. Manual refresh, configurable auto-refresh, and time-range controls keep your data up to date. Expanded panels include previous and next navigation, and image sharing captures the current chart on demand. Dashboard search, favorites, alert status, and layouts across iPhone, iPad, and Mac have also been improved. This release strengthens multi-server separation and preserves Grafana configuration when editing dashboard details. After updating, reselect the dashboard and panel in existing Home Screen widgets to reconnect their saved configuration.
In-app purchases
The most popular purchases on the App Store.
- CoffeeConsumableUSD 3.99
- DinnerConsumableUSD 11.99
- LunchConsumableUSD 6.99
More from WhiteMatter Technology, LLC

You might also like
 GrafanaUIRoman Senchuk
 IoT PanelsPhilipp Arndt
 OtterButterRifat Cagri Ekin
 GrafiumBoris Zhenikhov
 RebootXc100k
 PushWardMACIEJ KEDZIORA
 Dashy - Dashboard MonitoringMaximilian Kenfenheuer
 InKuber - Kubernetes DashboardPraboda Madushan Ariyasingi Appu HennadI Thotahewage
 Dashboard For Argo CDJediLabs
 Kubeterm - Kubernetes Client明 戴