
Number Analytics
Number Analytics LLC
No ratings yetProductivityAges 4+
Screenshots




About this app
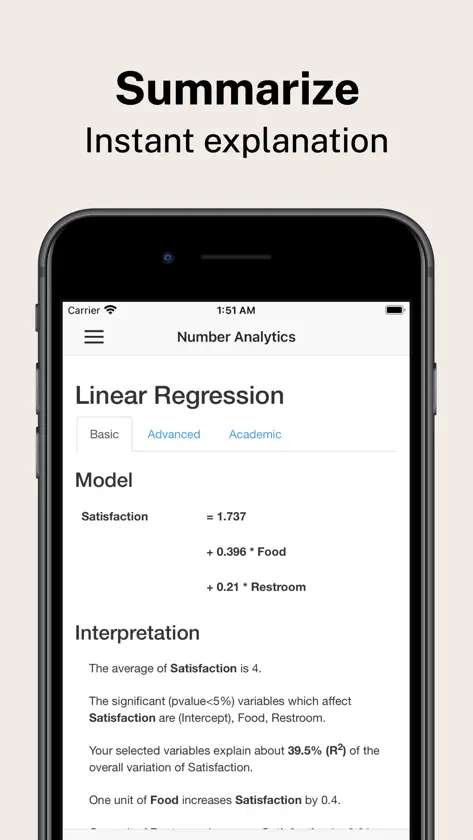
Number Analytics is a statistical software for advanced statistical tests, regression analysis, text analysis, and survival analysis. It supports multiple data formats like SPSS, Minitab, Excel, CSV, STATA and SAS. The software provides powerful graphs and tables for mean difference tests (T-test, ANOVA), linear regression, logistic regression, K-means clustering, and survival analysis (Kaplan-meier plot). Text cloud visualization enables you to analyze unstructured customer feedback text data in seconds. Easily analyze your data anytime, anywhere with smartphones and tablets. Terms of Use: https://www.apple.com/legal/internet-services/itunes/dev/stdeula/ Statistical analysis is critical to improving business, society, and how we live. Market research for new product development, social science research at universities, and medical research at hospitals are all looking for statistically significant data patterns based on actual, experimental, or survey data. Number Analytics is designed for users who are not good at coding and statistics, but need to easily analyze various types of data for their research on their mobile devices. In the past, analyzing data meant spending hours preparing data, summarizing summary statistics, performing numerous statistical analyses based on hypotheses, and finding statistically significant relationships between variables. Especially for beginners, selecting the right statistical models and interpreting the results are the pain points and require considerable time and effort. Now it can be done with clicks and automation that can speed up the process at least 10 times. With Number Analyzer, the computer will automatically apply these statistical models and explain the statistical results in plain English. Because the computer knows which statistical models to use, you can run more than 100 statistical analyses at once. The statistical results, such as linear regression and ANOVA, show not only statistical test results, but also graphs with confidence intervals and marginal effects, and tables coded with statistical differences between subgroups. To upload your own data, first download or move your data to iCloud storage. Then click the Upload button in the Data section. You can easily upload and use the data. Various data formats are supported including labelled survey data (SPSS). Supported data file formats - SPSS, Excel, CSV, Minitab, STATA, SAS Currently the upload file size is limited to 2Mb. Descriptive statistics -Summary Statistics -Frequency Table -Crosstab (Chi-sq. Test) -Pivot table -Correlation -Text analysis Mean Difference test -One Sample T-test -Paired Sample T-test -Independent Samples T-test -ANOVA (Analysis of Variance) test Regression Analysis - Linear Regression - Fixed Effect Regression - Logistic Regression Clustering Analysis - K-Means Clustering Survival Analysis -Kaplan Meier plot
What's new
Version 1.0.7 · Feb 18, 2025
Add subscriptions (basic, advanced, and premium plans).
In-app purchases
The most popular purchases on the App Store.
- Basic planSubscription7,99 $US / month
- Premium planSubscription119,99 $US / month
- Advanced planSubscription34,99 $US / month
You might also like
 STATS™ MobileDecision Analyst
 Rlytic R Programming EditorVerbosus.com
 Data ExplorerA&X Analytics, LLC
 Charts IQ: Chart & Graph MakerNitish Rokade
 GraphVVI, INC.
 Lean Management ToolboxDenny Hartmann
 Line-FitBjarne Berge
 Uploader for MendeleySven Gowal
 Statistics CalculationAshvin Kevadiya
 Anoc Octave EditorVerbosus.com