
StratChart
Kunihiro Goto
No ratings yetFinanceAges 4+
Screenshots

About this app
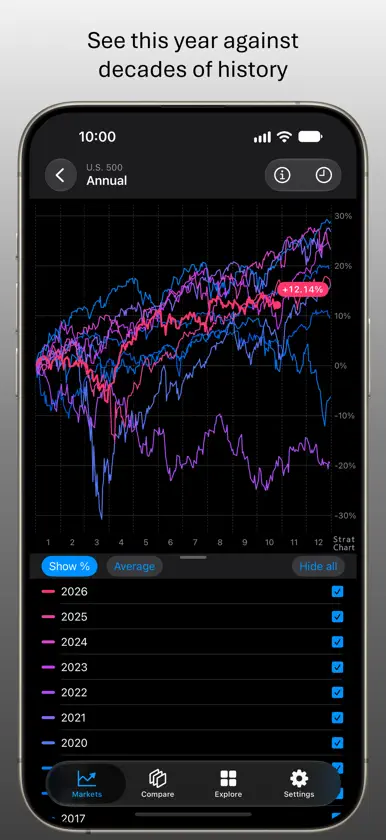
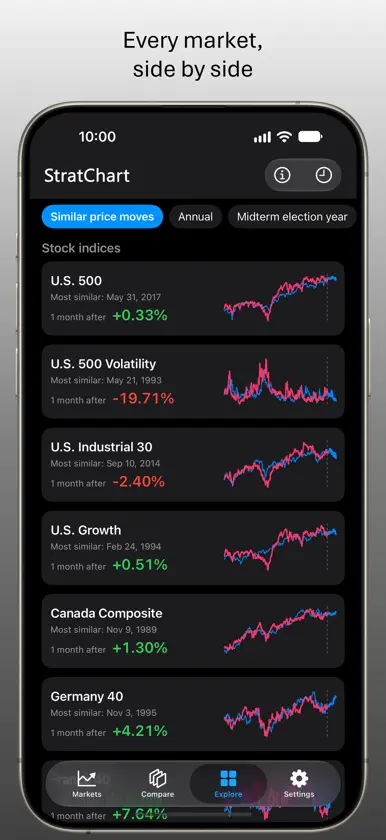
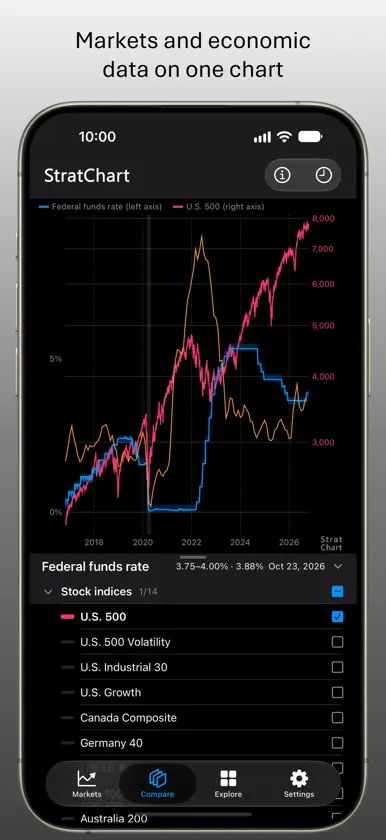
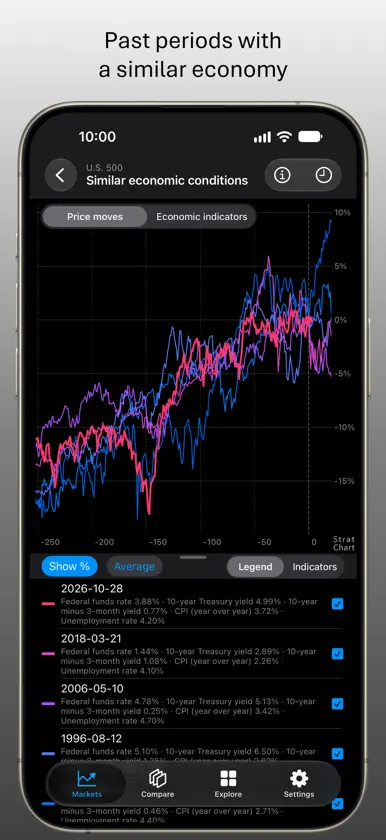
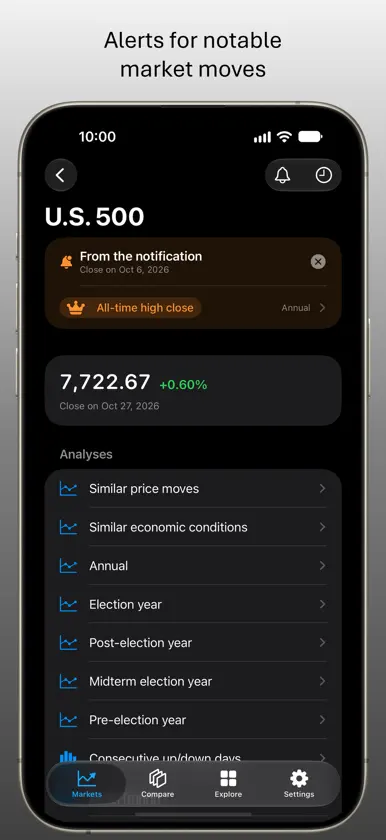
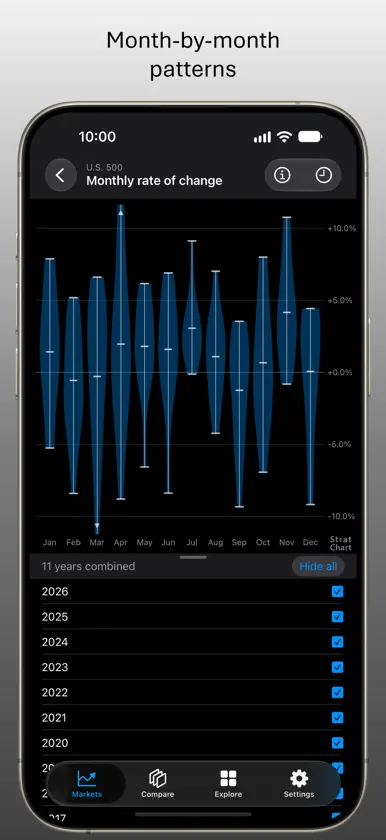
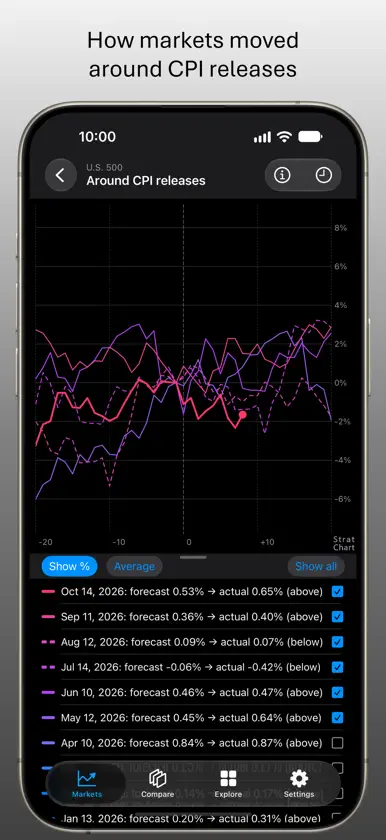
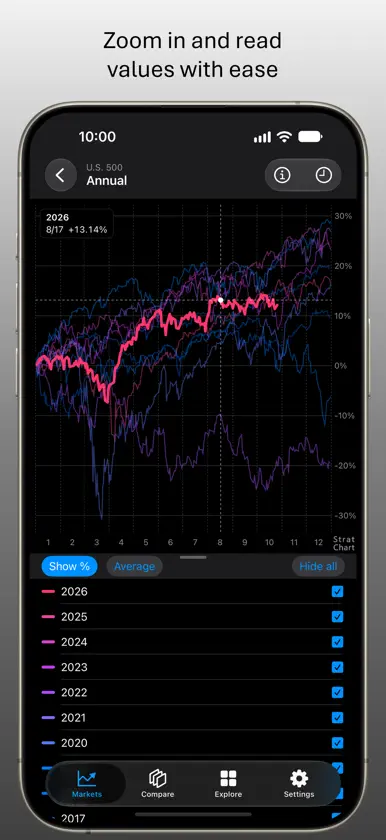
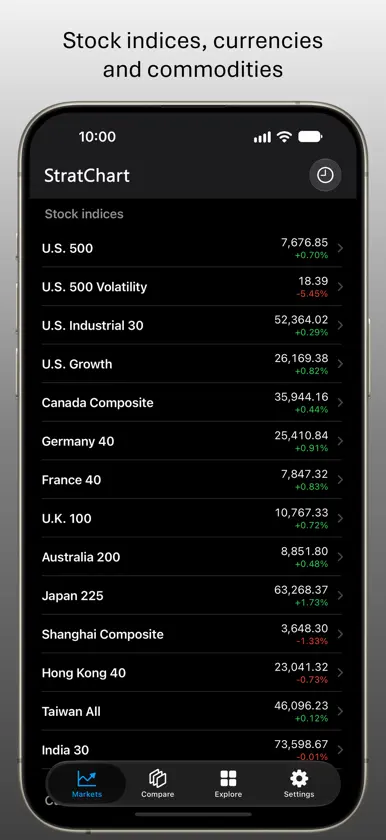
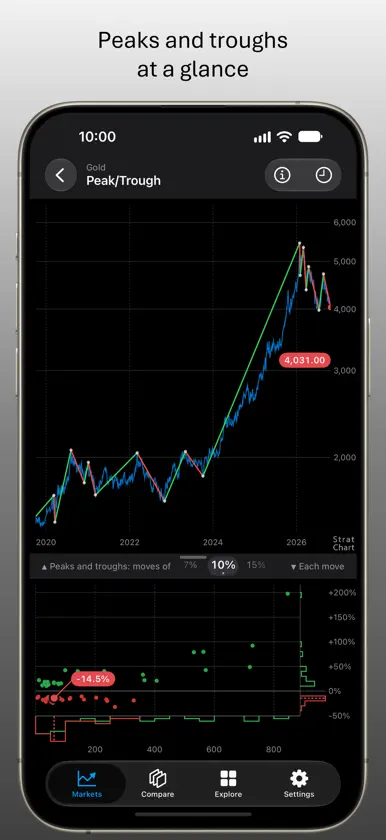
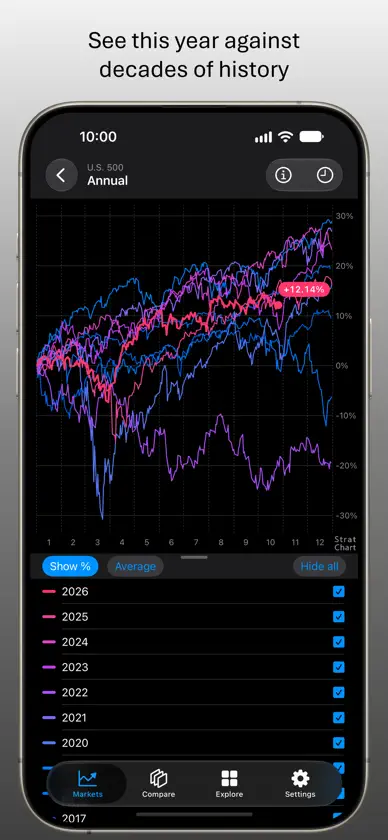
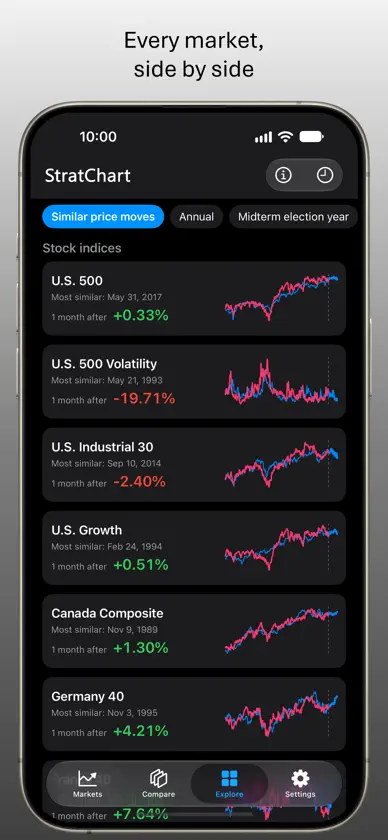
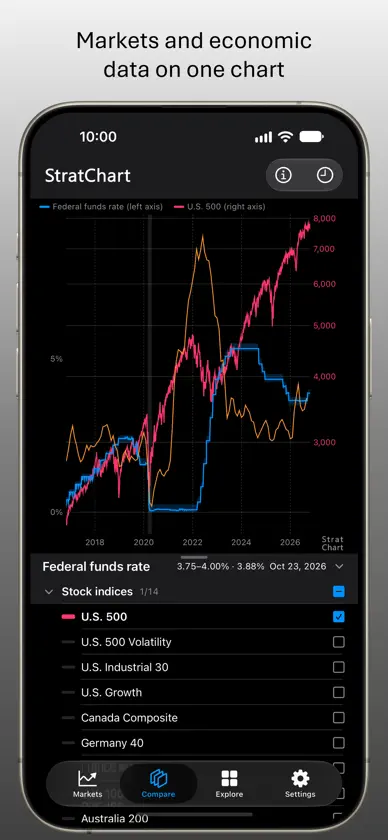
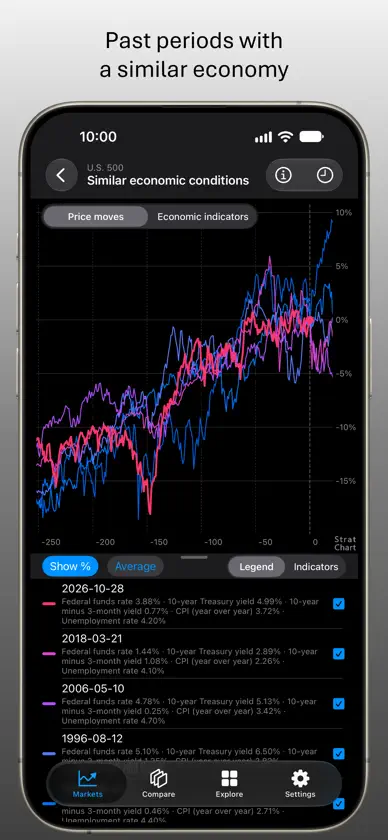
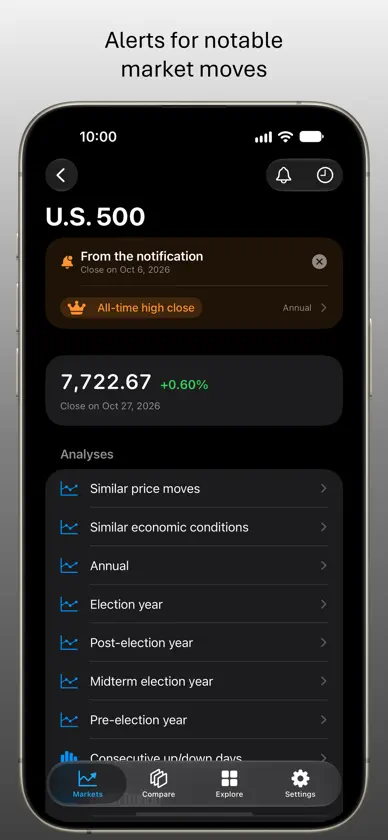
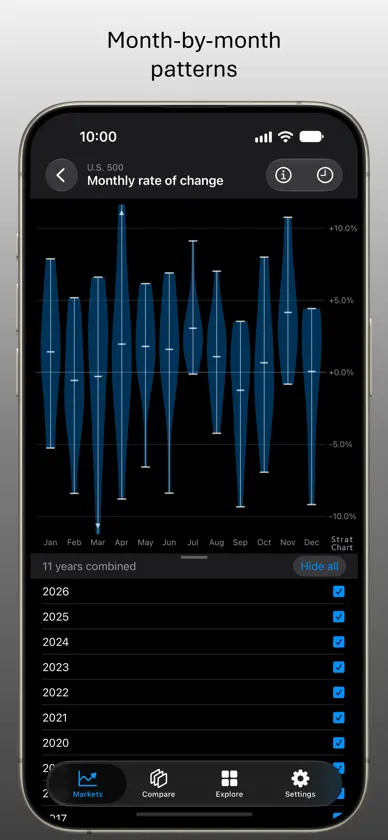
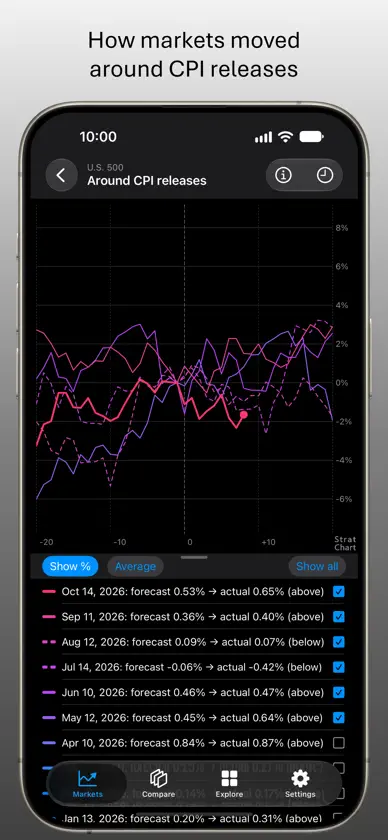
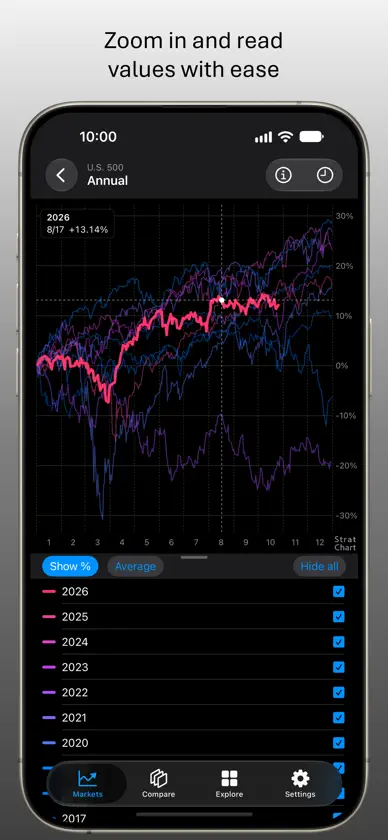
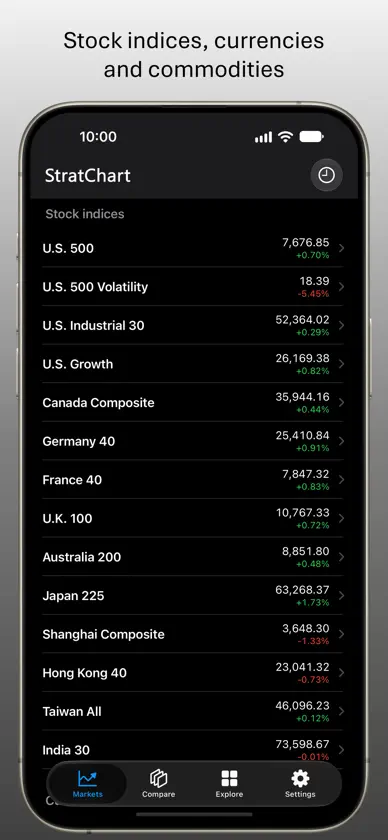
StratChart shows how the world's major stock indices, currencies and commodities have behaved in the past, so you can see where today's market stands against decades of history. Market Catalog Stock indices: United States, Canada, Germany, France, United Kingdom, Australia, Japan, Shanghai, Hong Kong, Taiwan and India, plus the volatility index of U.S. stocks. Currencies: USD/JPY, EUR/USD and GBP/USD. Commodities: gold, silver, copper, crude oil, natural gas and platinum. Analysis Catalog - Yearly: every year's path on one chart, with this year's latest close highlighted - The four-year U.S. presidential cycle, and the 100 days before and after U.S. presidential and midterm elections - Similar price moves: the past periods whose year moved most like the last year, and the month that followed - Similar economic conditions: the past periods whose price moves and U.S. economic indicators you choose were most like today - Rate of change by day of the week, by date and by month: violin plots that combine the years you choose - Consecutive up/down days, peaks and troughs, and the first vs. second half of the year - Around U.S. CPI releases (with the expected and actual figures), jobs reports and FOMC decisions, and around U.S. recessions - With economic indicators: the market and a U.S. economic indicator you choose, on one chart Explore Pick an analysis and see every market side by side as cards. Swipe to switch analyses, and tap a card to open its chart. Compare Put markets and 37 U.S. economic indicators (interest rates, inflation, jobs and the economy, money supply, and government finances) on one chart with two axes, with U.S. recessions shaded. Notifications Get notified when the markets you choose set a record (an all-time high, a year-to-date high or low, or the best or worst year-to-date performance in 20+ years), reach a turning point (a milestone, the 200-day moving average, a correction, a bear market or a bull market), make a big one-day move, or rise or fall 5 or more days in a row. Open a notification to see what happened and jump to the related chart. About a week before the end of a month, you can also find out if the next month has tended to rise or fall. Easy to Explore Pinch to zoom like a photo, drag or flick to scroll, drag along an axis to zoom just that axis, long-press to read values, and double-tap to reset. Short tutorials show the basics, and you can replay them from Settings. Each chart has an explanation behind the "i" button. The app is also available in Japanese. Growing Analysis Catalog When we add new analyses or features, we will let you know on the News page in the app. Membership All users can access all analysis items. Free members receive the analyses, economic data and notifications with a one-week delay, while subscription members get the latest analyses and same-day notifications. Note StratChart is designed for educational purposes. The information does not predict or guarantee future prices. Please do not make investment decisions based on the information provided by the app.
What's new
Version 3.0 · Oct 31, 2026
StratChart 3.0 adds a new Explore tab and finds past periods with similar economic conditions. • New Explore tab: pick an analysis and see every market side by side as cards. Swipe left or right to switch analyses, and tap a card to open its chart. • New analysis, "Similar economic conditions": past periods whose price moves and U.S. economic indicators (how they were trending and where they stood) were most like today. Choose the indicators yourself and view their charts alongside. • "Similar past patterns" is now "Similar price moves". • New analysis, "Monthly rate of change": how each month has moved over the past 20 years. • New notification: about a week before the end of a month, find out if the next month has tended to rise or fall. • Line charts can show the average of the years you check. The % view of the yearly and presidential-cycle charts now starts from the previous year's last close. • Peaks and troughs: change the size of the moves (5–30%) by dragging, with distributions of their length and size. • Drag the bar between a chart and its list to resize the chart. Charts keep scrolling after a flick, and you can swipe from the edge of the screen to switch tabs. • Short tutorials for the Explore tab and "Similar economic conditions". • Visual improvements throughout the app.
In-app purchases
The most popular purchases on the App Store.
- Premium 1 yearSubscription$999.00 / year
- Premium 1 monthSubscription$99.00 / month
You might also like
 SubGuard PROENES CINAR
 Capital Markets BrokersCapital Markets Brokers Ltd
 BullMoodBlack Tower Investments Ltd.
 AIVA eyesOgidani LLC
 Stock Trading AI - CripVizCripviz
 Külçe: Gold, FX, ZakatKazim Altintop
 Holdy Crypto Portfolio TrackerTaras Sorokin
 Edge FXEdgewater Markets
 Kimi SignalsMaker Design Ltd
 FearGreed+秀 王